



Drawing the world: How maps changed the course of exploration
Long before GPS could tell us exactly where we were, humans had to find their way using stars, landmarks, coastlines, rivers and carefully drawn maps.
A map may look like a simple representation of geography, but throughout history it has been much more than that. Maps have helped people travel across oceans, plan military campaigns, establish trade routes, claim territories and understand the shape of the world.
They have also changed the way people imagined the planet itself.
From ancient clay tablets to sophisticated digital maps, the history of cartography is closely connected to the history of exploration. Some maps recorded what people already knew. Others encouraged people to search for places that had never been seen by the mapmaker.
In that sense, maps did not merely show the world. They helped humanity discover it.
The first attempts to draw the world
Humans were making maps long before modern geography existed.
One of the earliest surviving examples is the Babylonian World Map, created on a clay tablet more than 2,500 years ago. It presents the known world from a Babylonian perspective, placing Babylon at the centre.
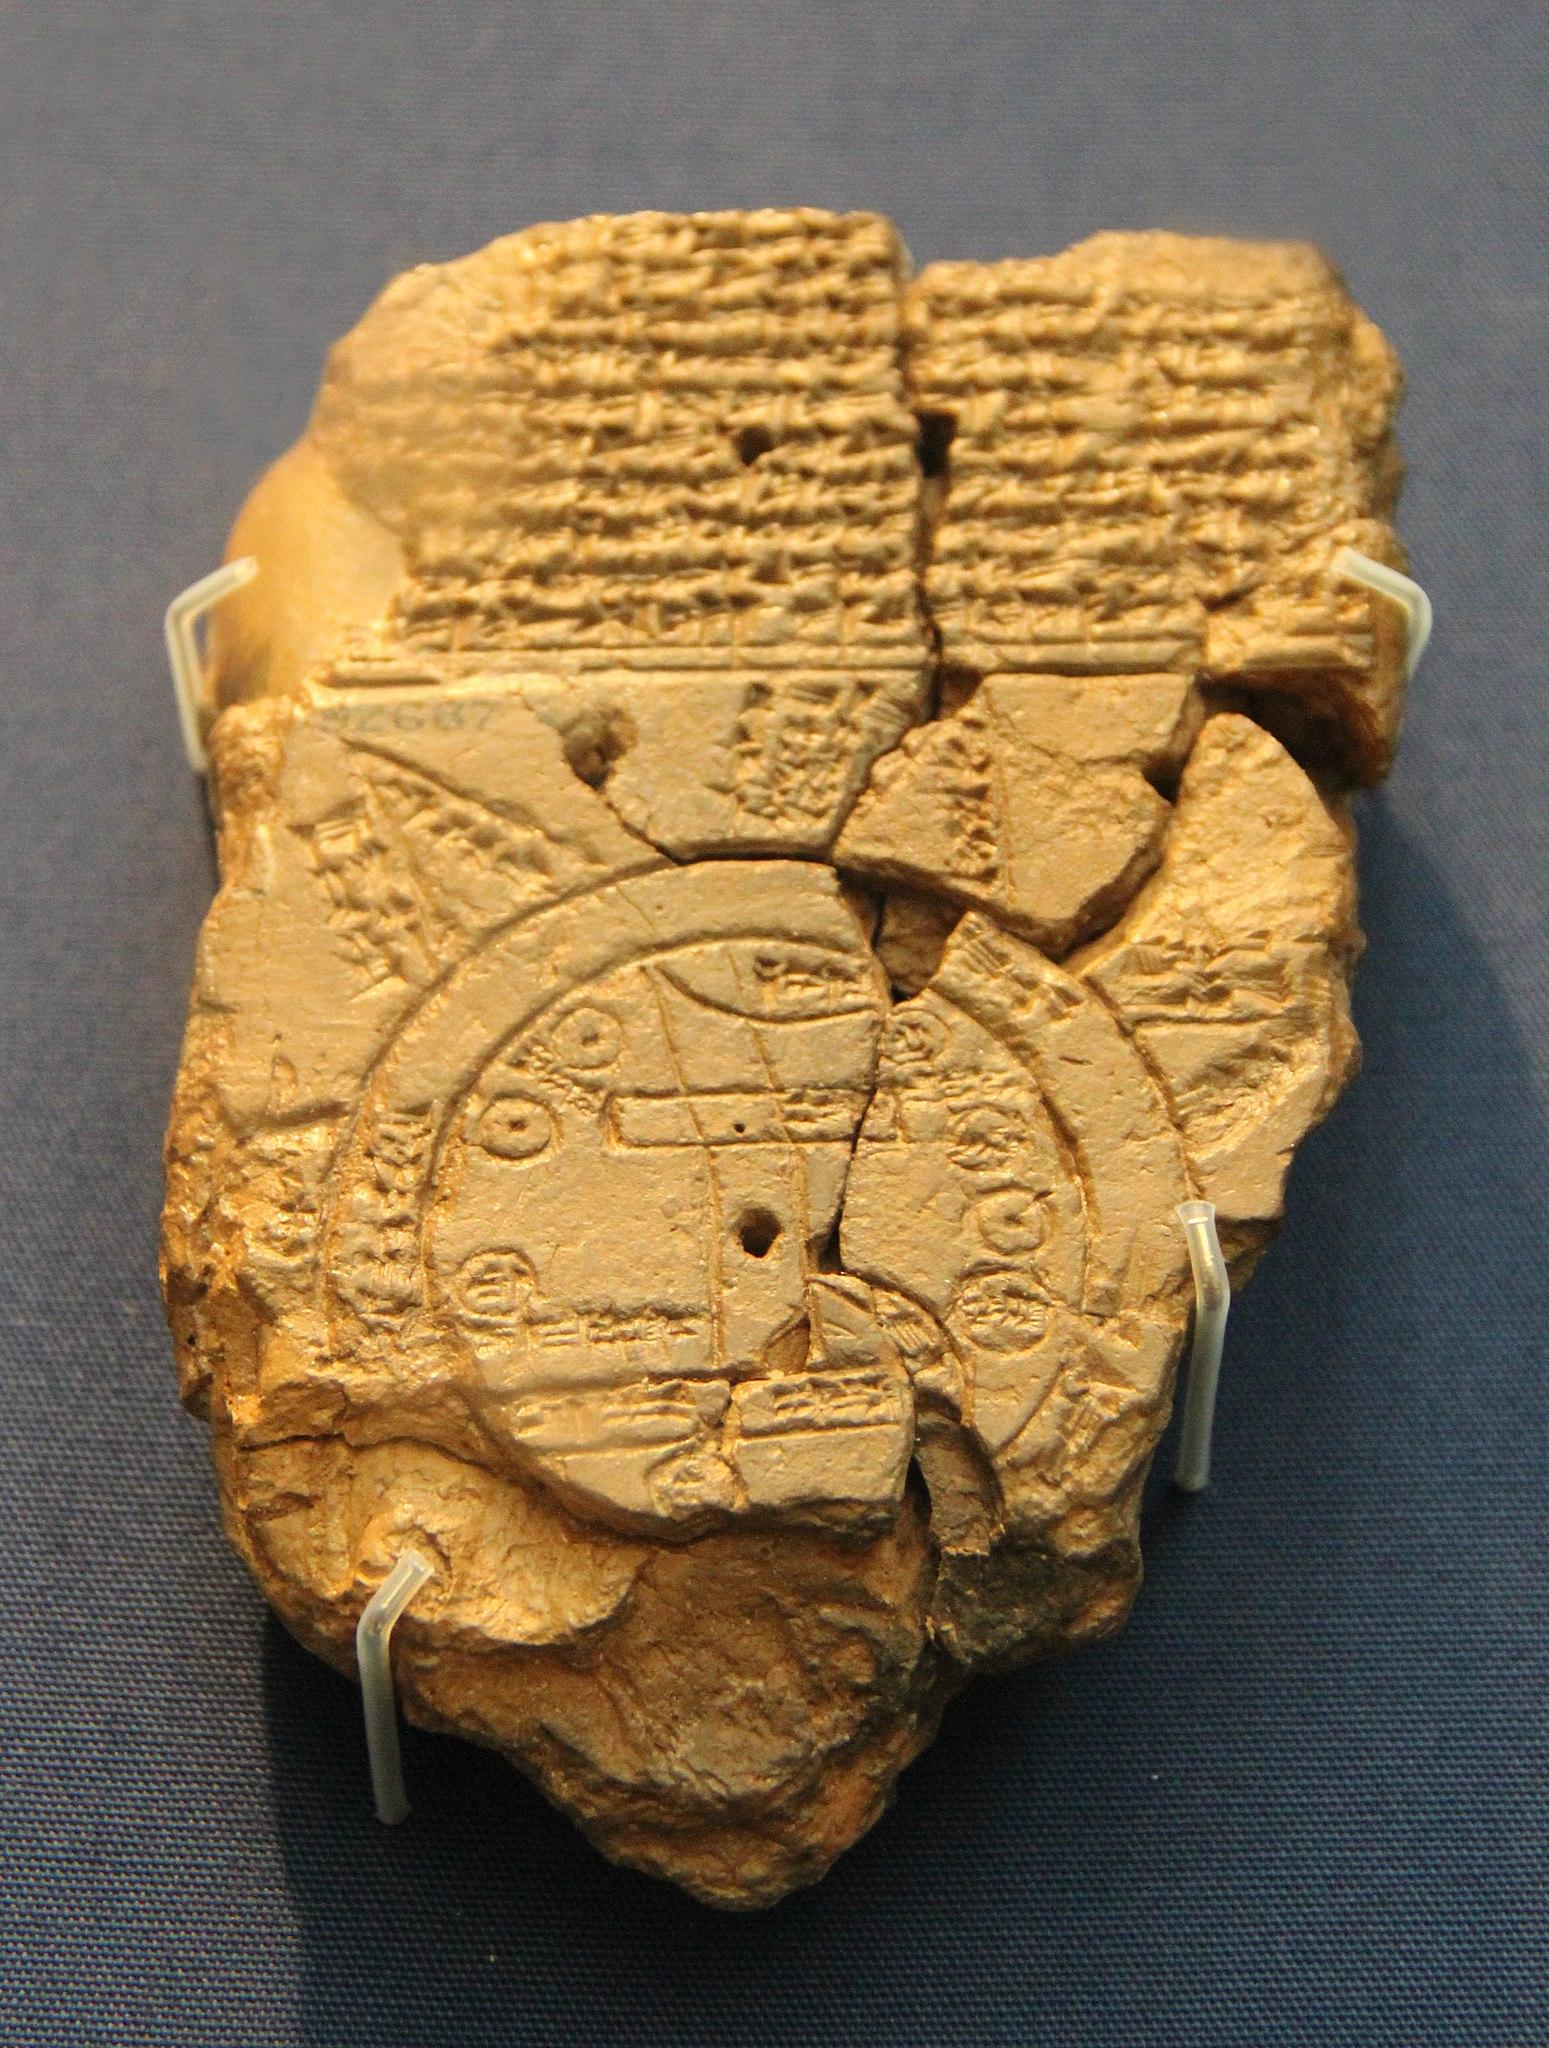
Ancient maps were not always designed to provide the precise geographical information expected today. Many represented political territories, religious beliefs, travel routes or the creator’s understanding of the universe.
The Greeks later introduced more systematic approaches to geography.
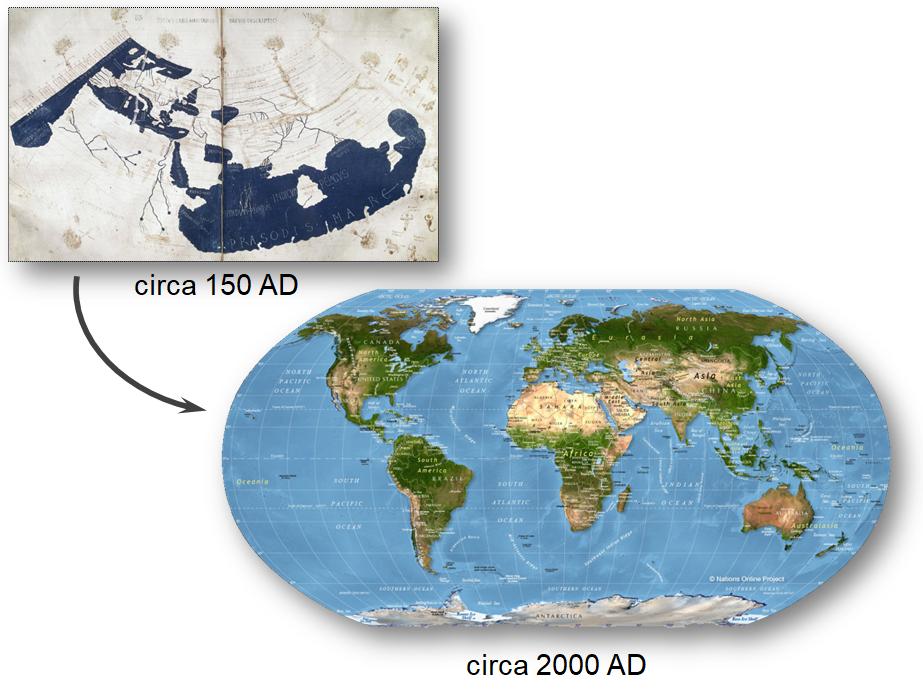
The second-century scholar Claudius Ptolemy, who worked in Alexandria, developed a geographical system based on coordinates of latitude and longitude. His Geographia became enormously influential centuries later when it was rediscovered and printed in Europe. The Library of Congress describes Ptolemy’s work as a major foundation for the development of European cartography.
The idea that locations could be represented using a coordinate system was revolutionary.
It transformed geography from a collection of descriptions into something that could be measured and plotted.
Maps become tools for exploration
As maritime travel expanded, maps became increasingly important to sailors.
Navigators needed information about coastlines, islands, harbours, currents and dangerous waters. Portolan charts, developed in the Mediterranean during the medieval period, provided detailed representations of coastlines and sailing routes.
European explorers later relied on increasingly sophisticated charts as they ventured into the Atlantic and beyond.
But there was a problem.
The Earth is round.
A map is flat.
Representing a spherical planet on a flat surface inevitably creates distortions.
This seemingly simple mathematical problem would have enormous consequences for the history of cartography.
The Mercator revolution
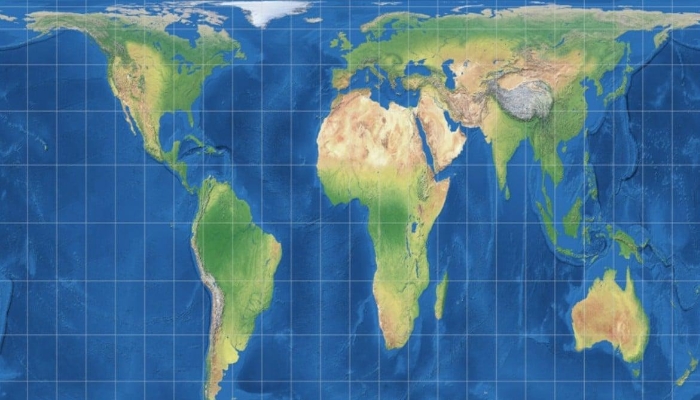
In 1569, Flemish cartographer Gerardus Mercator published a world map using what became known as the Mercator projection.
Its great advantage was navigation.
The projection preserved the angles of lines on the map, allowing sailors to plot constant compass bearings as straight lines. This made it extremely useful for maritime navigation.
However, the projection also dramatically distorts the size of landmasses as they approach the poles.
Greenland, for example, appears enormous compared with its actual area.
Mercator’s map therefore demonstrates an important truth about cartography: there is no completely neutral way to flatten a globe onto a sheet of paper.
Every projection makes choices about what to preserve and what to distort.
The map is not the world itself.
It is a particular mathematical interpretation of the world.
The map that named America
Few maps have had such a profound historical influence as Martin Waldseemüller’s 1507 world map.
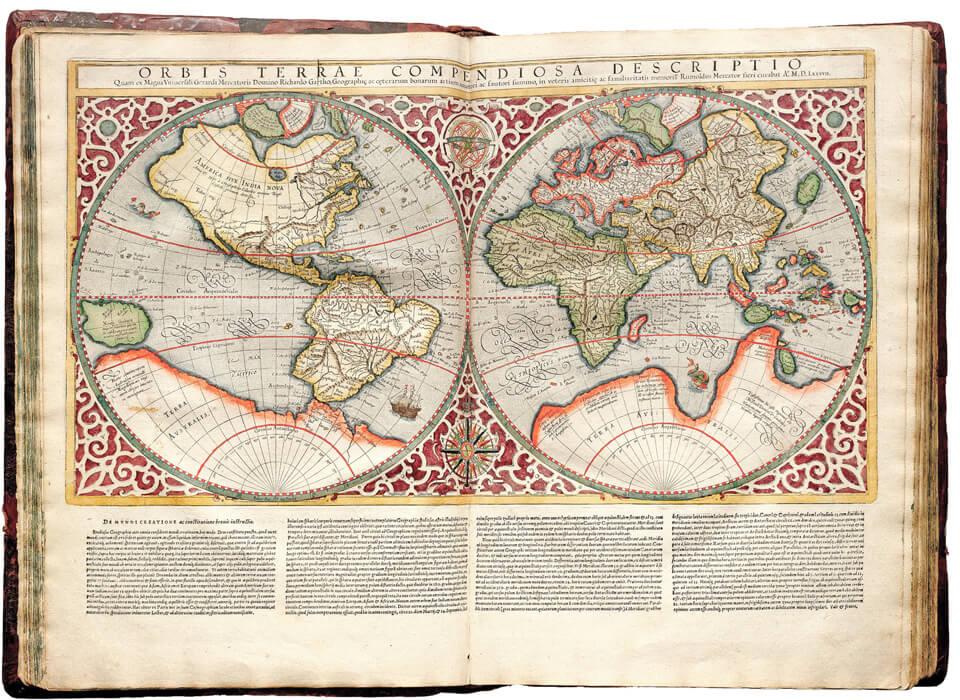
Created during the period of European exploration, it was the first known map to use the name “America.” The name was derived from the Latin form of Amerigo Vespucci’s first name.
The map was produced at a time when European scholars were struggling to understand the geographical significance of voyages across the Atlantic.
It did not get everything right.
In fact, early maps of the Americas contained major errors because cartographers were working with incomplete information. But they were constantly being revised as new observations arrived.
The Library of Congress notes that Waldseemüller’s later 1516 map incorporated substantially more contemporary geographical knowledge than his 1507 map.
This reveals something fascinating about maps.
They are snapshots of human knowledge at particular moments in history.
A blank space on a map does not necessarily mean a place did not exist. It may simply mean the mapmaker did not yet have reliable information about it.
Maps and the Age of Exploration
During the European Age of Exploration, cartography became inseparable from global expansion.
As ships returned from distant voyages, information about coastlines and islands was added to European maps. Cartographers combined reports from sailors with earlier geographical knowledge to create increasingly detailed representations of the world.
The process was rarely straightforward.
Explorers made mistakes. Sailors disagreed about locations. Distances were miscalculated. Entire coastlines were sometimes drawn incorrectly.
Yet each voyage provided new information.
Maps became living documents that changed as knowledge expanded.
The more accurately people could represent the world, the more confidently they could navigate it.
Maps, trade and empire
Cartography also became a tool of political and economic power.
A map could identify valuable ports, fertile agricultural regions, mineral resources and strategic waterways. Governments and trading companies therefore had strong incentives to improve geographical knowledge.
Maps were used to plan trade routes and military campaigns and to define territorial claims.
This connection between cartography and power remains an important subject for historians.
A map does not simply answer the question, “Where is this place?”
It can also answer questions such as, “Who controls it?”, “Who has access to it?” and “What is considered important?”
The development of European atlases illustrates this transformation. In 1570, Abraham Ortelius published Theatrum Orbis Terrarum, widely regarded as the first modern atlas. It brought together maps of different regions into a single, consistent publication and helped transform the European map trade.
Maps that changed how we see ourselves
Maps do more than help people travel.
They shape mental images of the planet.
The way countries are positioned, the size given to continents, the borders drawn between territories and the names placed on geographical features all influence how people understand the world.
This is particularly important because maps can make particular perspectives appear natural or inevitable.
A map centred on Europe creates a different visual impression from one centred on Asia or the Pacific.
A map that enlarges certain regions can make them appear more geographically significant than they actually are.
Modern cartographers therefore recognise that mapmaking involves both science and interpretation.
From paper to satellites
Today, cartography has entered an entirely new era.
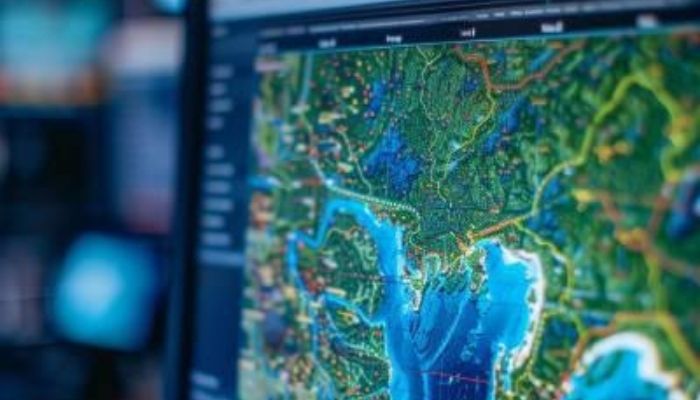
Satellites can photograph the Earth’s surface in extraordinary detail. Global Positioning System technology can determine a location within a relatively small margin of error. Geographic information systems allow researchers to combine maps with enormous quantities of environmental, demographic and economic data.
A smartphone can now provide information that would once have required years of exploration.
Yet the fundamental challenge remains the same.
Humans are trying to represent a complex three-dimensional world in a form that can be understood and used.
The technology has changed dramatically.
The problem has not.
Maps beyond geography
Modern maps are no longer limited to roads and physical landscapes.
Scientists map the human genome. Astronomers map the surfaces of planets. Epidemiologists map the spread of diseases. Climate scientists map changes in temperature and rainfall. Researchers create maps of ocean currents, forests, animal migration and even neural activity in the brain.
The concept of mapping has become a general method of understanding complex systems.
To map something is to turn information into a pattern that humans can see and interpret.
The unfinished map
Perhaps the most fascinating thing about cartography is that no map is ever truly finished.
The world changes.
Coastlines shift. Cities expand. Rivers change course. Borders move. New roads are constructed. Climate change alters landscapes.
Our knowledge changes too.
The history of maps is therefore also a history of human curiosity.
Every blank space represented something people wanted to understand. Every new coastline added to a chart represented another piece of knowledge. Every improvement in measurement brought the image of the planet closer to reality.
From clay tablets and hand-drawn charts to satellites and digital maps, cartography has accompanied humanity’s desire to explore.
The next time a navigation app quietly guides you to your destination, it is worth remembering what lies behind that simple blue line.
Thousands of years of observation, mathematics, astronomy, exploration and human ingenuity are contained within it.
Maps have helped humanity cross oceans and discover new lands.
But perhaps their greatest achievement has been something even more fundamental.
They taught us how to imagine the world.
Sources
- Library of Congress, Geography and Map Division: Ptolemaic atlases and the history of cartography
- Library of Congress, The Naming of America and Martin Waldseemüller’s 1507 map
- Library of Congress, Seeing the World Anew
- Library of Congress, European atlases and Abraham Ortelius
- Encyclopaedia Britannica, history of cartography and map projections
- Smithsonian Institution, collections and research on exploration and cartography
- Imago Mundi: The International Journal for the History of Cartography
Related News
Sri Lanka to introduce New School Curricula and National Preschool Education Reforms
Significant changes are set for Sri Lanka’s school curriculum from 2027, including reducing the G.C.E. Ordinary Level examination to seven core subjects…
Read MoreSchool children visit Presidential Secretariat to mark ‘Vision’ programme anniversary
Students from Pinnawala Central College and Matale Siri Seevali College visited the Presidential Secretariat on September 24 to mark the completion of…
Read More
Health Ministry stresses need for pre- school standards
The Government and relevant institutions hold a responsibility to ensure proper care for children during early childhood development, Secretary to the Ministry…
Read More
Estate-sector students celebrated at British Council NextGen ceremony
Over 100 students from three Tamil-medium estate-sector schools were recognized at the NextGen Skills Awards Ceremony and Student Showcase held at Araliya…
Read More
Applications Open for the Inaugural Upali Ratnayake Scholarship Scheme
Applications are now open for the inaugural Upali Ratnayake Scholarship Scheme, a prestigious initiative established to honour the legacy of Upali Ratnayake…
Read MoreCourses
-

The future of higher education tech: why industry needs purpose-built solutions
For years, Institutions and education agencies have been forced to rely on a patchwork of horizontal SaaS solutions – general tools that… -

MBA in Project Management & Artificial Intelligence – Oxford College of Business
In an era defined by rapid technological change, organizations increasingly demand leaders who not only understand traditional project management, but can also… -

Scholarships for 2025 Postgraduate Diploma in Education for SLEAS and SLTES Officers
The Ministry of Education, Higher Education and Vocational Education has announced the granting of full scholarships for the one-year weekend Postgraduate Diploma… -

Shape Your Future with a BSc in Business Management (HRM) at Horizon Campus
Human Resource Management is more than a career. It’s about growing people, building organizational culture, and leading with purpose. Every impactful journey… -
ESOFT UNI Signs MoU with Box Gill Institute, Australia
ESOFt UNI recently hosted a formal Memorandum of Understanding (MoU) signing ceremony with Box Hill Institute, Australia, signaling a significant step in… -

Ace Your University Interview in Sri Lanka: A Guide with Examples
Getting into a Sri Lankan sate or non-state university is not just about the scores. For some universities' programmes, your personality, communication… -
MCW Global Young Leaders Fellowship 2026
MCW Global (Miracle Corners of the World) runs a Young Leaders Fellowship, a year-long leadership program for young people (18–26) around the… -
Enhance Your Arabic Skills with the Intermediate Language Course at BCIS
BCIS invites learners to join its Intermediate Arabic Language Course this November and further develop both linguistic skills and cultural understanding. Designed… -
Achieve Your American Dream : NCHS Spring Intake Webinar
NCHS is paving the way for Sri Lankan students to achieve their American Dream. As Sri Lanka’s leading pathway provider to the… -
National Diploma in Teaching course : Notice
A Gazette notice has been released recently, concerning the enrollment of aspiring teachers into National Colleges of Education for the three-year pre-service… -
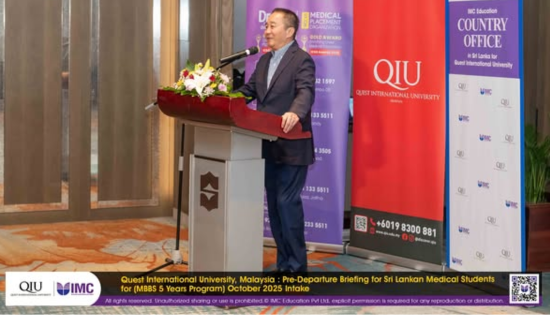
IMC Education Features Largest Student Recruitment for QIU’s October 2025 Intake
Quest International University (QIU), Malaysia recently hosted a pre-departure briefing and high tea at the Shangri-La Hotel in Colombo for its incoming… -
Global University Employability Ranking according to Times Higher Education
Attending college or university offers more than just career preparation, though selecting the right school and program can significantly enhance your job… -

Diploma in Occupational Safety & Health (DOSH) – CIPM
The Chartered Institute of Personnel Management (CIPM) is proud to announce the launch of its Diploma in Occupational Safety & Health (DOSH),… -
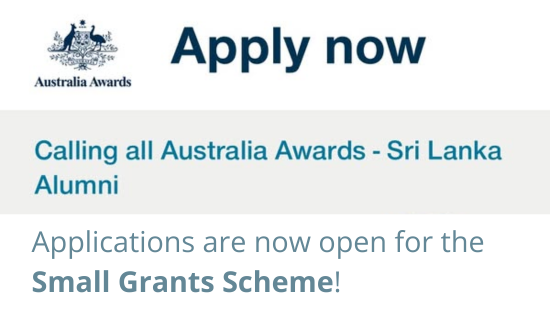
Small Grant Scheme for Australia Awards Alumni Sri Lanka
Australia Awards alumni are warmly invited to apply for a grant up to AUD 5,000 to support an innovative project that aim… -
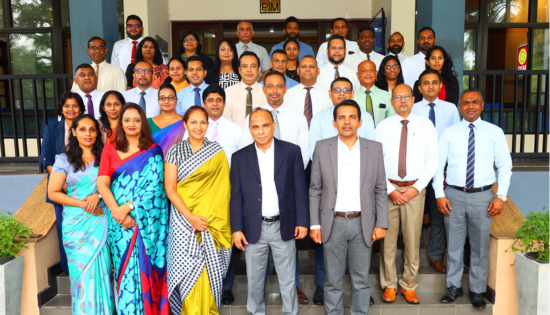
PIM Launches Special Programme for Newly Promoted SriLankan Airlines Managers
The Postgraduate Institute of Management (PIM) has launched a dedicated Newly Promoted Manager Programme designed to strengthen the leadership and management capabilities…
Newswire
-
‘ANIMALIA’: Vasantha Wanigasooriya Launches Wildlife Photography Book
ON: September 28, 2026 -
CBSL rates: US Dollar selling rate increases to Rs. 335
ON: September 28, 2026 -
Opposed to 22A, but staying with NPP: Lal Wijenayake
ON: September 28, 2026 -

Chamika on national duty in Japan as court issues warrant over non-appearance
ON: September 28, 2026 -
104 new Metro Buses to be introduced on several new routes from Tuesday
ON: September 28, 2026